 3D 3D Graphing Software
for Math and Physics Visualization
Start the program and you will see an example of a graph created by DPGraph. The graph displayed is determined by a program. Each line in the program is a separate command for DPGraph. For example, a simple program might look like this:
graph3d.view:=top
graph3d.perspective:=false
graph3d(z=3*sin(x*y))
Each command must start on a separate line and the GRAPH3D function with one or more equations must be the last command. DPGraph programs can be saved in files with a file type of .DPG. There are two kinds of DPG files: binary and ASCII. Binary DPG files are compressed and contain error detection information for more reliable transmission. ASCII DPG files are readable and editable by Notepad and many other text editors.
Unfortunately there is very little editing help when writing
a DPGraph program and the syntax is picky.
If you have a mistake the word syntax will appear at the lower left, but
there is no suggestion as to what or were the error is. Cutting and pasting programs from other
sources can help avoid typos. Common
errors include using 2x instead of 2*x, using = instead of :=, using sin x
instead of sin(x) and not having matching parentheses.
Begin you experimenting with DPGraph with a simple 2D demonstration. Select Edit from the top menu bar to enter the following program. A text box with the current code will appear. Select all of the current code and delete it. Carefully type ( or cut and paste) the following. This is a program to graph a sine function and display the x and y axes.
graph3d.box := true
graph3d.view := top
graph3d.perspective := false
graph3d( ( y = a*sin(b*x+c), x=0, y=0 ) )
Select Execute for the following display.
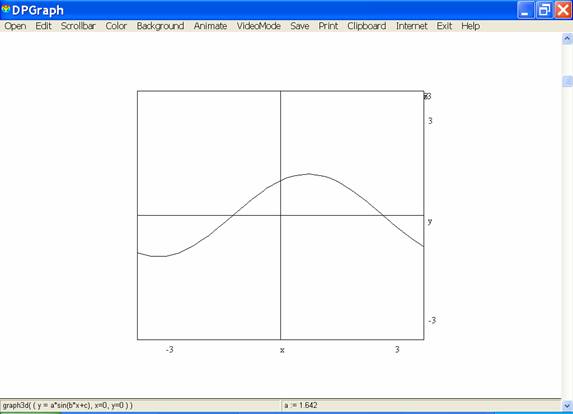
Note the axes appear to be labeled incorrectly. The x on the bottom does not really label the
axis. It actually indicates the x values
go from -
You can rotate your graph by the keyboard arrow keys to see
that it is really a 3d picture and you are just looking directly at the z axis.
A powerful educational tool in DPGraph is the ability to use the scroll bar to show the effects of the change of a value in a function. Select the Scrollbar from the top menu and choose “A variable” to link that variable to the scrollbar. Since a is the coefficient of the sine function it controls the height. Move the right hand scrollbar and observe the changes in the graph. Experiment with other variables.
Another nice option is the ease of copying a graph. Simply click on the CLIPBOARD menu option to copy a picture of the graph to the clipboard. It can then be pasted to another program, such as MSWord or Paint, to be printed or edited.
The Functions link is a
convenient way to learn about options, values, constants, variables, symbols,
and built in functions.
To learn more about this program try the